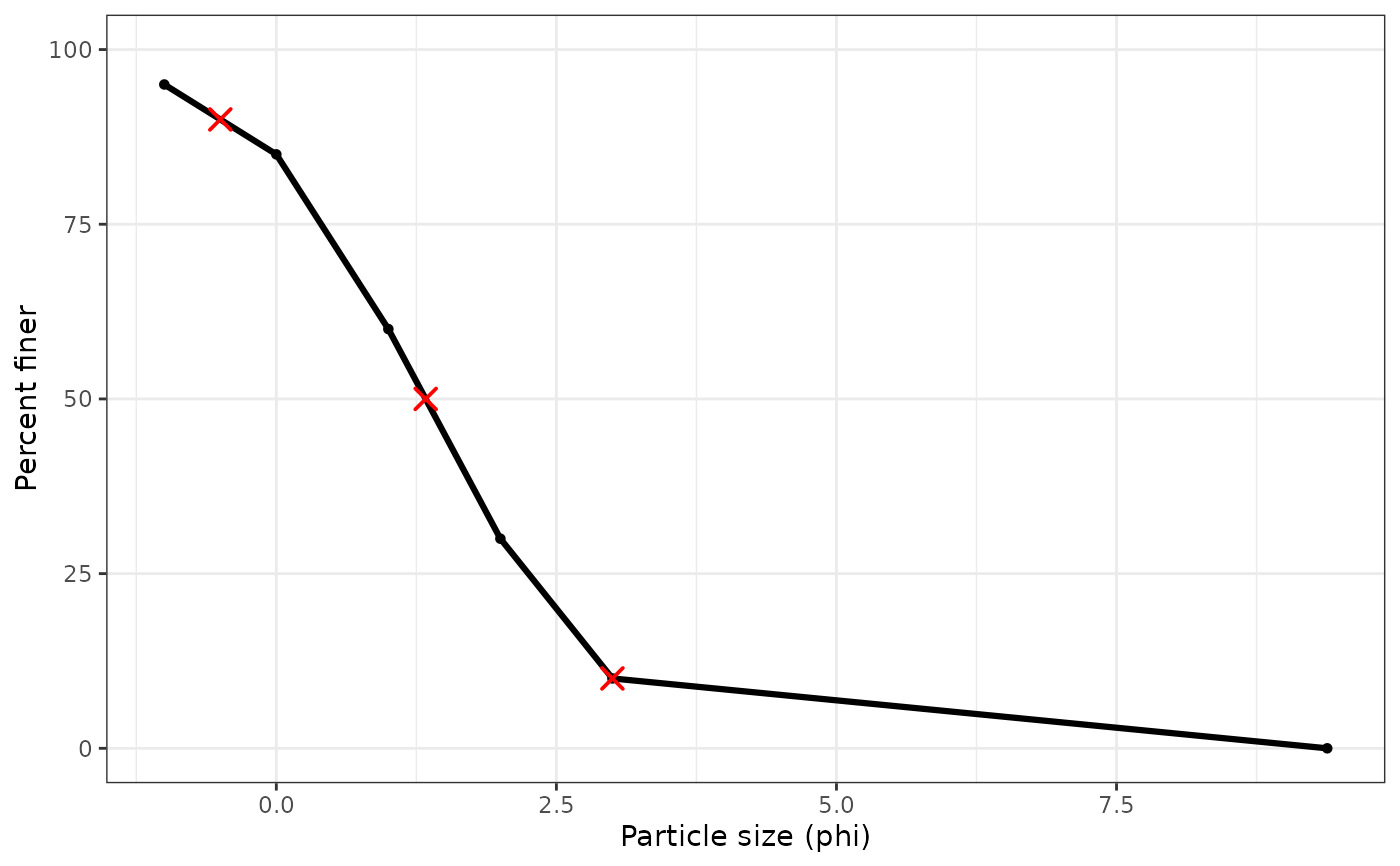
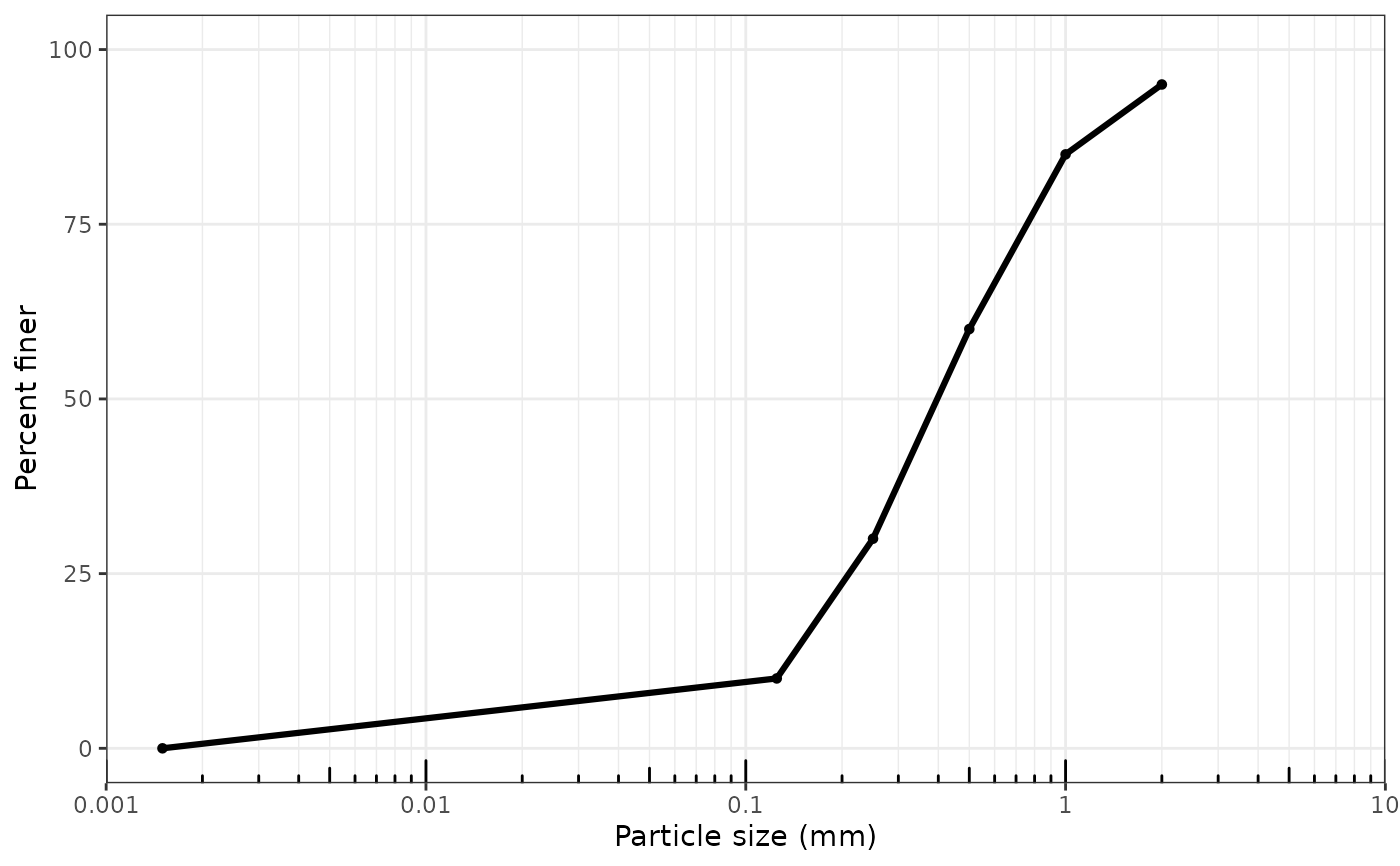
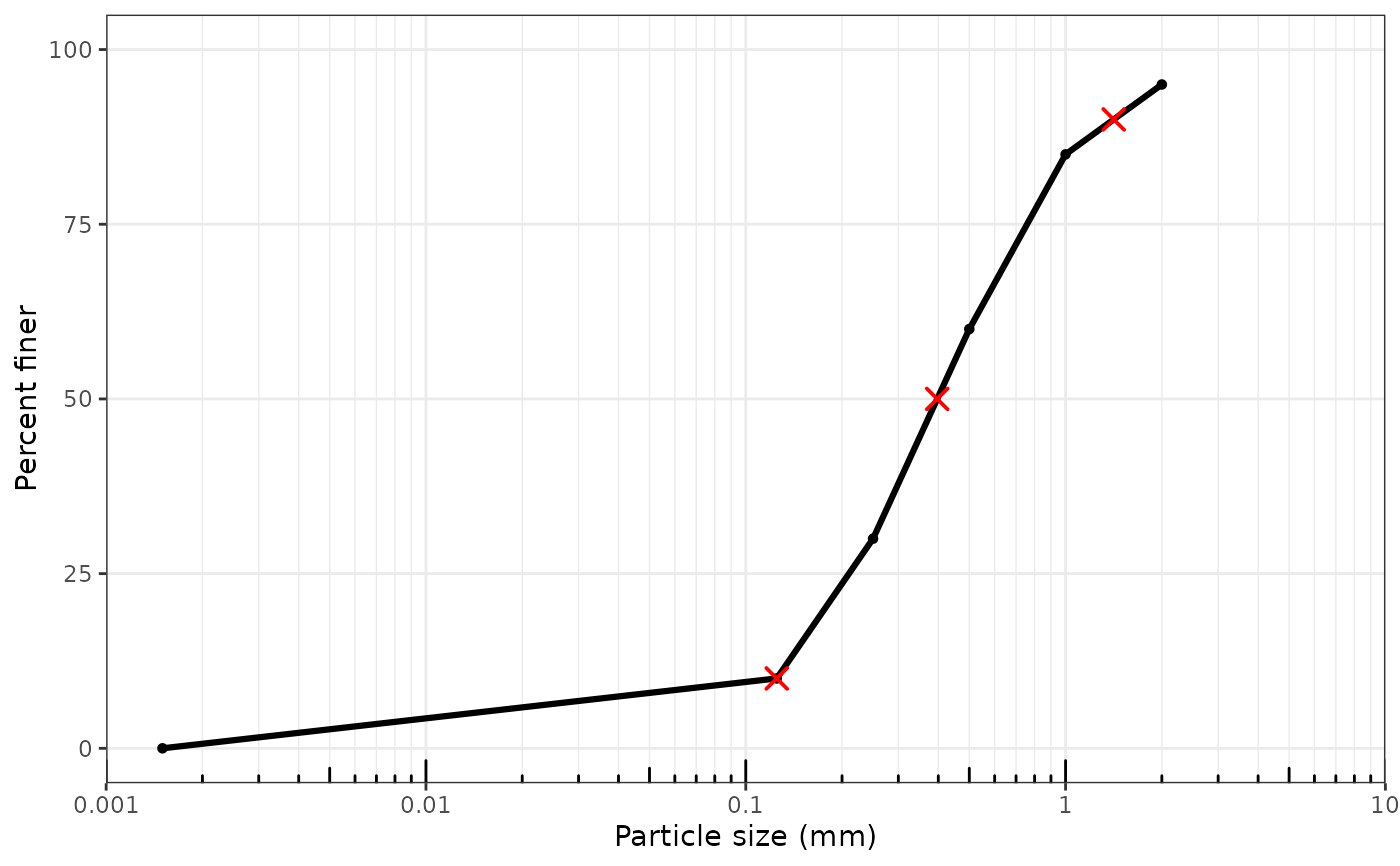
plot_cumulative() plots cumulative grain-size curves from gs_cumulative().
Lower open-ended classes are displayed at 0.0015 mm for plotting only.
Usage
plot_cumulative(
  x,
  direction = c("finer", "coarser"),
  x_scale = c("log10", "phi", "linear_um"),
  particle_unit = c("mm", "um", "milli", "micro"),
  sample = NULL,
  sample_id = NULL,
  show_percentiles = NULL,
  extrapolate = "error",
  percentile_color = "red",
  percentile_size = 3,
  percentile_stroke = 1,
  facet_by_sample = NULL
)
Arguments
- x
A valid
gsd_tblobject.- direction
Cumulative direction to plot.
- x_scale
Display scale for the grain-size axis.
"log10"uses grain-size values inparticle_unit;"linear_um"uses micrometre values;"phi"uses phi units.- particle_unit
Particle-size unit for
x_scale = "log10". Preferred values are"mm"for millimetres and"um"for micrometres. Aliases"milli"and"micro"are also accepted.- sample
Optional sample selector. A character value selects by sample ID; a numeric value selects by one-based sample index using the order in which samples appear in
x.- sample_id
Optional character vector of sample identifiers to include. Kept for backward compatibility; use
samplefor new code.- show_percentiles
Optional logical or numeric vector of D-value percentiles to mark on the plot.
TRUEmarks D10, D50, and D90.- extrapolate
Extrapolation behavior passed to
gs_d_values()whenshow_percentilesis supplied. With the default"error",plot_cumulative()retries marker placement with"warn_linear"if a requested percentile falls just outside the finite boundary curve; this affects only the plotted marker layer. Percentile markers falling on a plateau caused by consecutive zero-retained classes are placed usinggs_d_values()'s deterministic tie-breaking rule (see its documentation).- percentile_color
Color for percentile marker crosses.
- percentile_size
Size for percentile marker crosses.
- percentile_stroke
Stroke width for percentile marker crosses.
- facet_by_sample
Ignored compatibility argument. Cumulative plots are single-sample displays; use
sampleorsample_idto select one sample, loop over samples, or arrange returned plots externally with another plotting package.
Examples
x <- data.frame(
sample_id = "A",
size_mm = c(2, 1, 0.5, 0.25, 0.125, 0.063),
retained_proportion = c(0.05, 0.10, 0.25, 0.30, 0.20, 0.10)
)
gsd <- as_gsd_tbl(x, sample_id, size_mm, retained_proportion)
plot_cumulative(gsd, x_scale = "log10")
 plot_cumulative(gsd, sample = 1, show_percentiles = TRUE, extrapolate = "warn_linear")
 plot_cumulative(gsd, x_scale = "phi", show_percentiles = c(10, 50, 90), extrapolate = "warn_linear")